Do you want
to know who’s still great? My grandma, that's who! I already gave a summary of her general stupendousness last year, so I’ll just report on the things she accomplished over the last year. She sent 242
emails during the year, and I should admit that she became aware of my spread
sheeting on February 26 so all my data is probably biased after that point. I didn’t really notice any obvious changes in the data, so like any crappy researcher, I’ll just ignore the problem. A
good thing about having her read my statistical analysis was that she learned
how much I love her homemade buns, so now she makes them especially for me (I
can never say my writing never got me anything). I don’t have much information from the last three months of the
year since she was on a marathon vacation, so my seasonal data is also skewed,
but whatever. On with the analysis.
The form of
the emails remains mostly unchanged from last year’s, so the first thing
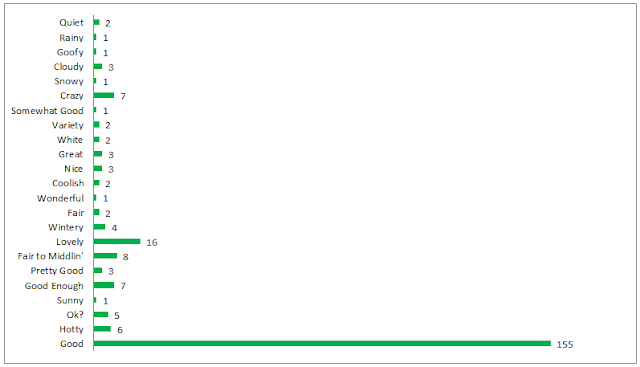
reported is still the weather. Her descriptions of the local Rapid City weather
break down as follows:
The worst description in there is probably Goofy, so it
looks like Rapid City is a nice place to live (From my own experience, I’d say it is). Grandma is
pretty stoic though, so her “Good” probably covers a broad range of weather. The
“Ok?” days come from September when she wasn’t getting outside due to her
sciatica (we also lost a whole month worth of card playing to that crap). Luckily my aunt healed her up so hopefully she feels better now.
High temperatures were reported for
16 separate towns, from Wisconsin (Wicksconsin) to California, over 231
non-consecutive days. Gold Canyon, Arizona had the highest average temperature
at 86.2°, they shared the highest temp of 109° with Dallas, Texas, and had the
highest temperature of anyone in the family 173 days (that’s 74.9% of the
time), and I will never forgive them for it. New Rockford, the origin point of
the family, was consistently the coldest, with an average of 50.9° and the
lowest recorded temperature of -16°. The average of all the local averages was
65.5°, which might be the most useless stat ever. Actually no, because I
tracked the number of times my grandma’s friends had their hair done (23). More importantly (?), Rapid City had a mean error
of 3.325° in the next day forecast, and was correct eight times out of 80.
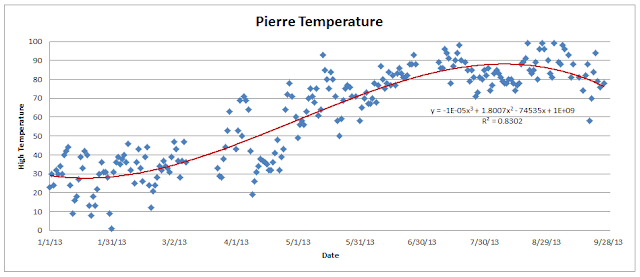
Pierre (where I live) had an
average of 60.5°, and a high of 99° and low of 1°, which has a nice symmetry to
it. My temperature was only superlative in the family on September 22nd, and I still shared
the high temperature (with friggin’ Gold Canyon). Let’s have a temperature
graph to help me get over Gold Canyon and their warm weather.
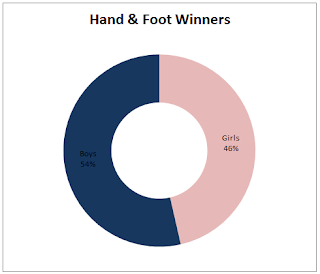
Grandma is still going to her
exercise class, and Robbie is still teaching it. She attended 74 times with an
average of 20 old goats jumping around (her words, not mine). That’s about 74
more times than I made it to the gym last year. Robbie busted out some new
moods this year including; wondering, hurting, crazy, remembering elvis,
razzed, gonna party, bad at fishing, questioning, missed, and ok. Some of those
might not technically be moods, but that’s what I wrote in my note so I’m counting them. He was still happy 35 times which
is 48% of the time (down nine percent from last year). That just doesn’t have
them same impact without the pie chart, so here goes.
On the days when grandma doesn’t
exercise she goes to the communal coffee hour (she still brews the coffee on
the days she doesn’t go, because she's great). The size of the bunch averaged 13.0 people on 85 occasions.
Conversation covered many diverse topics, including; Vivian’s pet deer,
Vivian’s 102 birthday, bootlegging and home brew, new apartment owners,
unwanted phone calls, Vivian’s immigration (multiple times), Jack's supplied paper work, farming in the
good ol’ days, Janice’s Montana ranch, foreigners getting our money, and
weather. Everyone’s blood pressure was checked twice (that I hear about), and grandma was 140/68
and 130/68 (I don’t know enough about blood pressure to understand if that is
good or not). Sunday mornings are spent at Mass. I was prayed and lit candle for on 30 reported
occasions.
Reported mid-day activities were baking 26 times (buns five of those
times!), sewing 76 times, shopping 44 times, and eight trips to visit Grandpa in the graveyard. She entertained guests 27 times, which resulted in at
least eight trips to Ruby Tuesday (her favorite restaurant). I think I can make
an asinine graph from this.
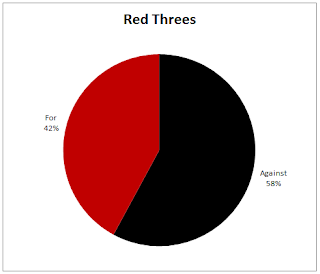
Evenings are still spent playing
cards with the occasional game of bingo on Mondays. Hand and Foot is still the most
popular with 141 games played. I like it because it’s graph friendly. See:
Pinochle is another favorite with
76 games played. Grandma took all the tricks a total of 14 times and got double
pinochle in 38 instances. She also had a winning year with a record of 88-87.
Let’s celebrate with some pie.
Bingo winnings came in at $61.00
this year. With 27 games, that's $2.26 a game, which isn’t bad (keep in mind that
Grandma gets excited when she makes $3 for mending her neighbors pants). Her
friends were also winners. Maxine won 11.5 times (split once), Vivian six
times, and Chuck 14.5 times (he even won a blackout).
I had to change the way I recorded the closing quotes this year because we were just getting way to many new
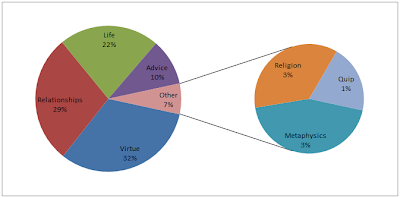
quotes. I divide the quotes into seven categories that I think cover everything
anyone can say about anything; Advice, Quip, Commentary on Life, Relationships,
Religion, Metaphysics, and Virtue. Virtue was the winner with 119 appearances,
but Relationships was in a close second with 105. And because it is basically
the name of the game, here is a graph about quotes.
Don’t worry, we’re not done (you
were worried right?). Catchphrases, all the greats have them, and my grandma is
no different. I still don’t know what it means, but “so gates” showed up 321 last year, or 1.32 times per email (up 0.16 from last year!). The
“vashislous” count was down to 18, and we had eight “yah voult”s (can you
pluralize a quote like that?). Some of my other favorite
Grandmaisms, as I call them, where questionable Rip Van Winkle references (did he
have a little yellow pup?), Majic, falling into all caps when talking about
Hand and Foot during the long losing streak, mentioning a lady with a baby bump
in a tight t-shirt, Harold going bananas, calling her car a red hotrod, being
fat and happy, plugging my aunt and uncles vegetables, and getting excited
about watching Rudy on TV (a football game show).
Grandma
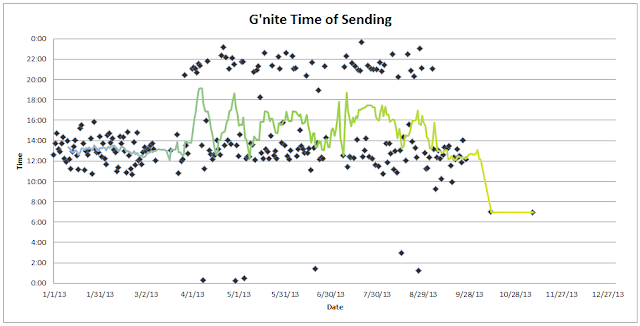
didn’t go to bed any earlier last year. The average time sent for the emails
came out to 2:48 am. I think some were sent the next morning, but there
were still plenty of legitimate 2 am sendings. I’m still not really comfortable
with doing math using time in excel, but I converted everything into a 24 hour
time with midnight being 12:00. It works alright I guess (I did figure out how
to do math in stationing notation, which has nothing to do with my grandma’s
emails and is also pointless since I don’t work in engineering anymore, but I’m
still excited about it). Anyway, here’s a graph:
Finally, I
was only mentioned seven times last year. I guess I need to give grandma some
more rides if I want to keep getting name dropped.
“If I have a thousand ideas and only one turns out to be
good, I am satisfied.” Alfred Nobel
“Never was anything great achieved without danger.” Niccolo
Machiavelli





No comments:
Post a Comment